EpiCurves: epicurves in ggplot with ggsurveillance
Source:vignettes/Epicurves_with_ggsurveillance.Rmd
Epicurves_with_ggsurveillance.RmdEpi Curve examples
This vignette is still work in progress. But the examples are hopefully already helpful and inspiring.
Ebola Outbreak in Kikwit, Democratic Republic of the Congo 1995
ggplot(outbreaks::ebola_kikwit_1995, aes(x = date, weight = onset)) +
  geom_epicurve(date_resolution = "week") +
  scale_x_date(date_breaks = "2 weeks", date_labels = "%V'%g", name = "week") +
  scale_y_cases_5er() +
  theme_bw()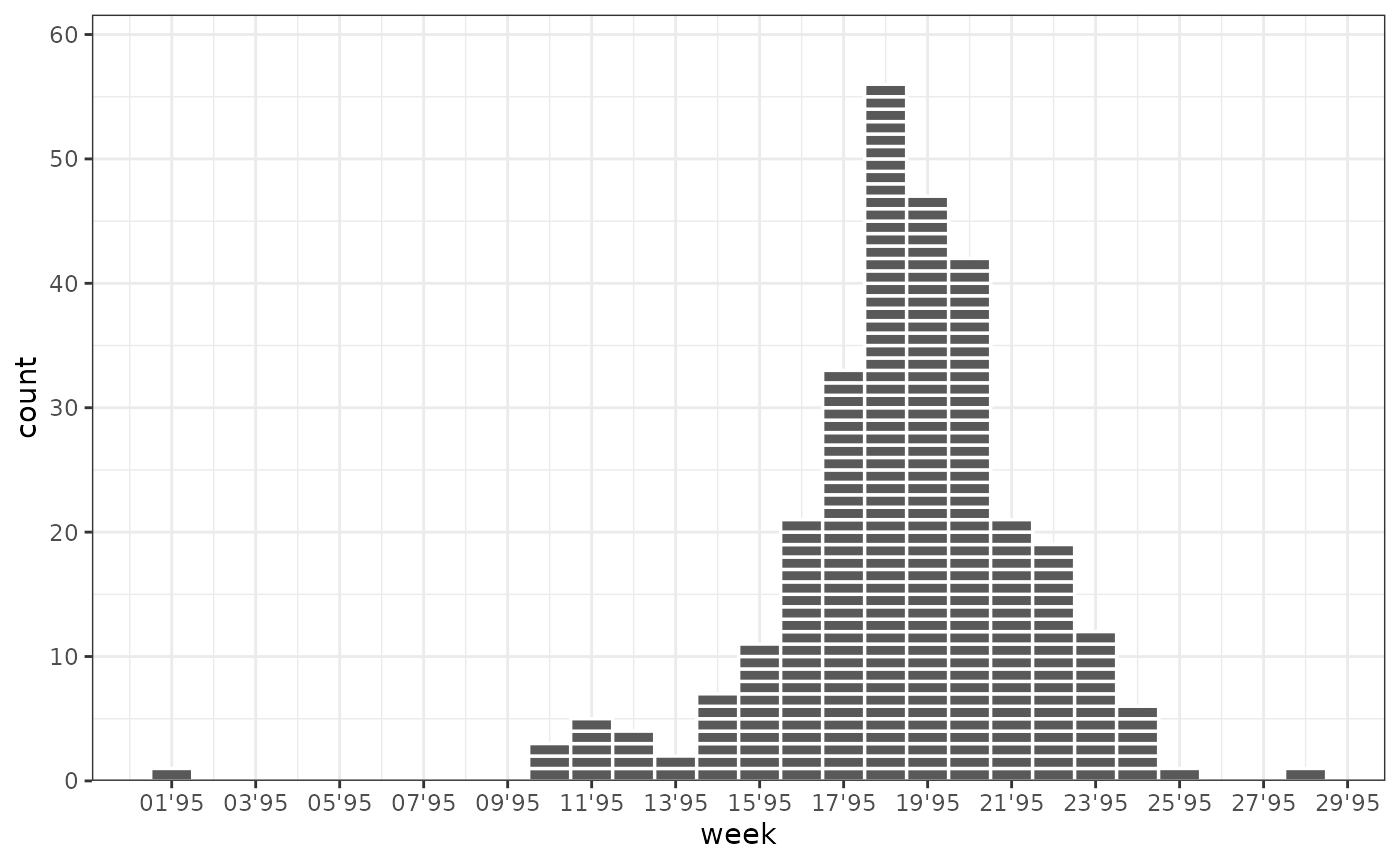
SARS Outbreak in Canada 2003
outbreaks::sars_canada_2003 |>
  pivot_longer(starts_with("cases"), names_prefix = "cases_", names_to = "origin") |>
  ggplot(aes(x = date, weight = value, fill = origin)) +
  geom_epicurve(date_resolution = "week") +
  scale_y_cases_5er() +
  theme_bw()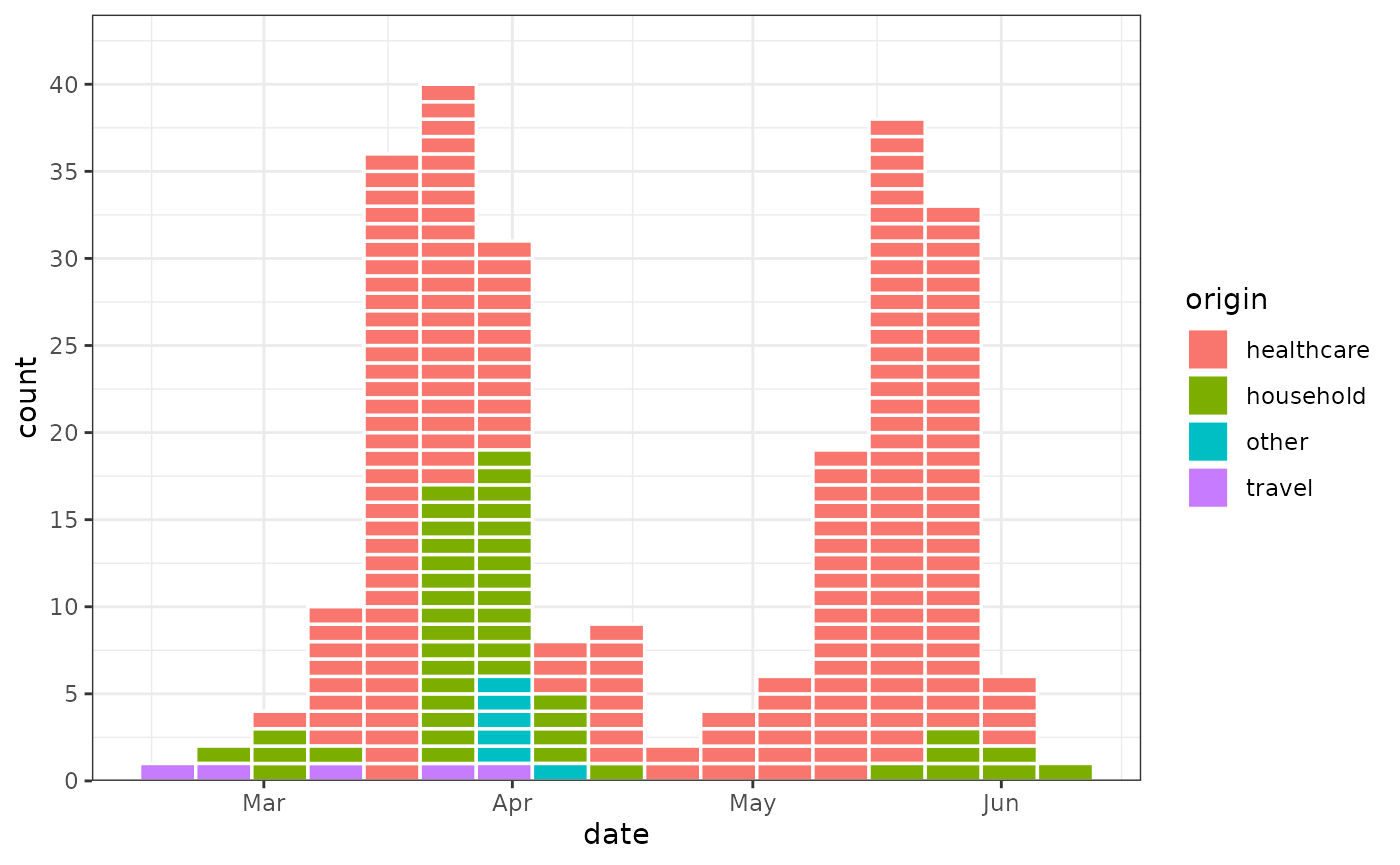
Influenza Data from Germany 2020-2025
-
align_dates_seasonal()defines the influenza seasons -
geom_vline_year()marks the turn of the years -
scale_y_cases_5er()creates a y-axis with more ticks and aligns 0 with the x-axis.
influenza_germany |>
  # Keep Age Groups 00-14, 15-59, 60+
  filter(AgeGroup != "00+") |>
  # Calc Influenza Seasons
  align_dates_seasonal(dates_from = ReportingWeek) |>
  ggplot(aes(x = ReportingWeek, weight = Cases, fill = season)) + # , weight = Cases
  geom_vline_year(color = "grey50") +
  geom_epicurve(color = NA, stat = "bin_date", date_resolution = "week") +
  scale_y_cases_5er() +
  theme_bw()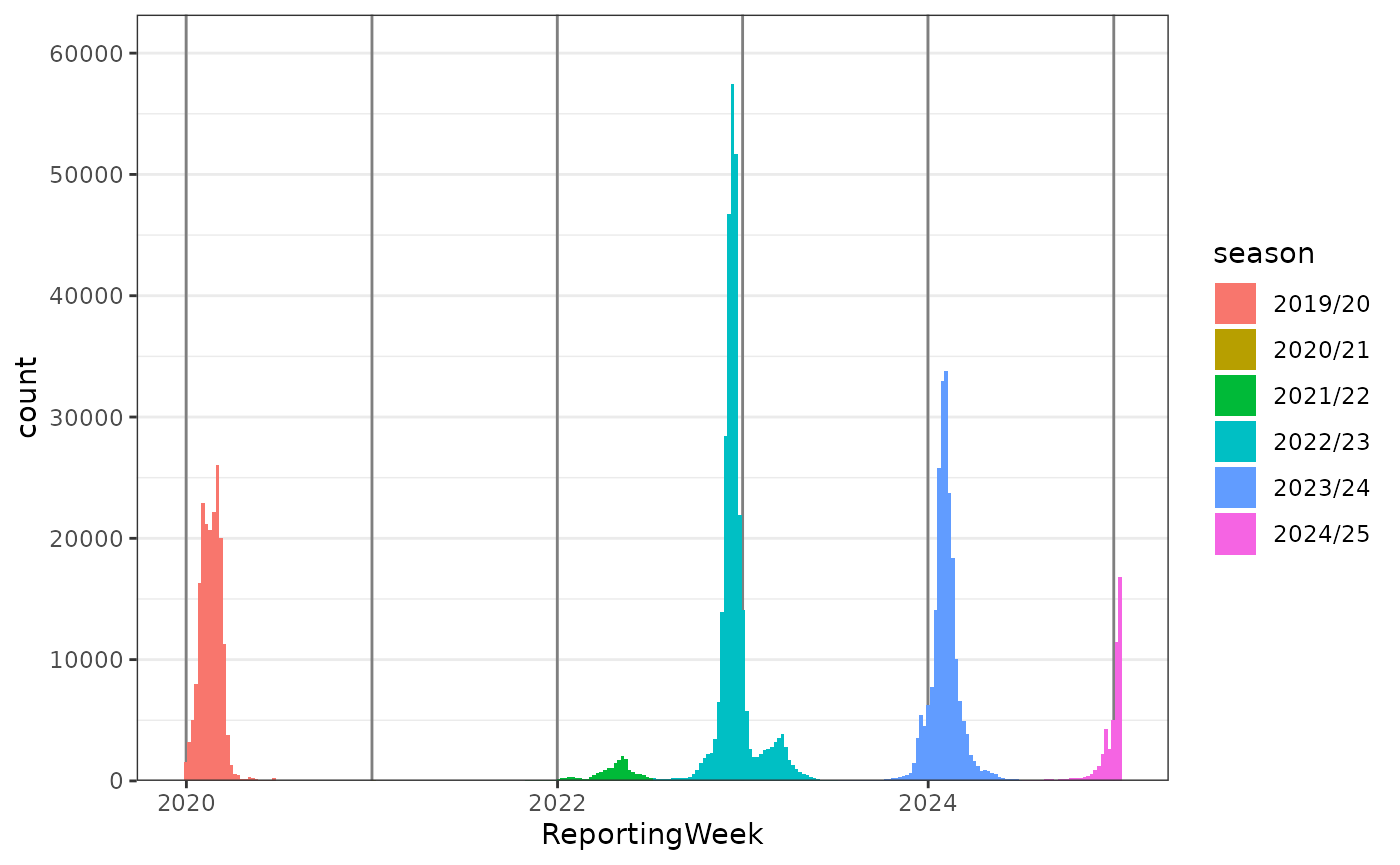
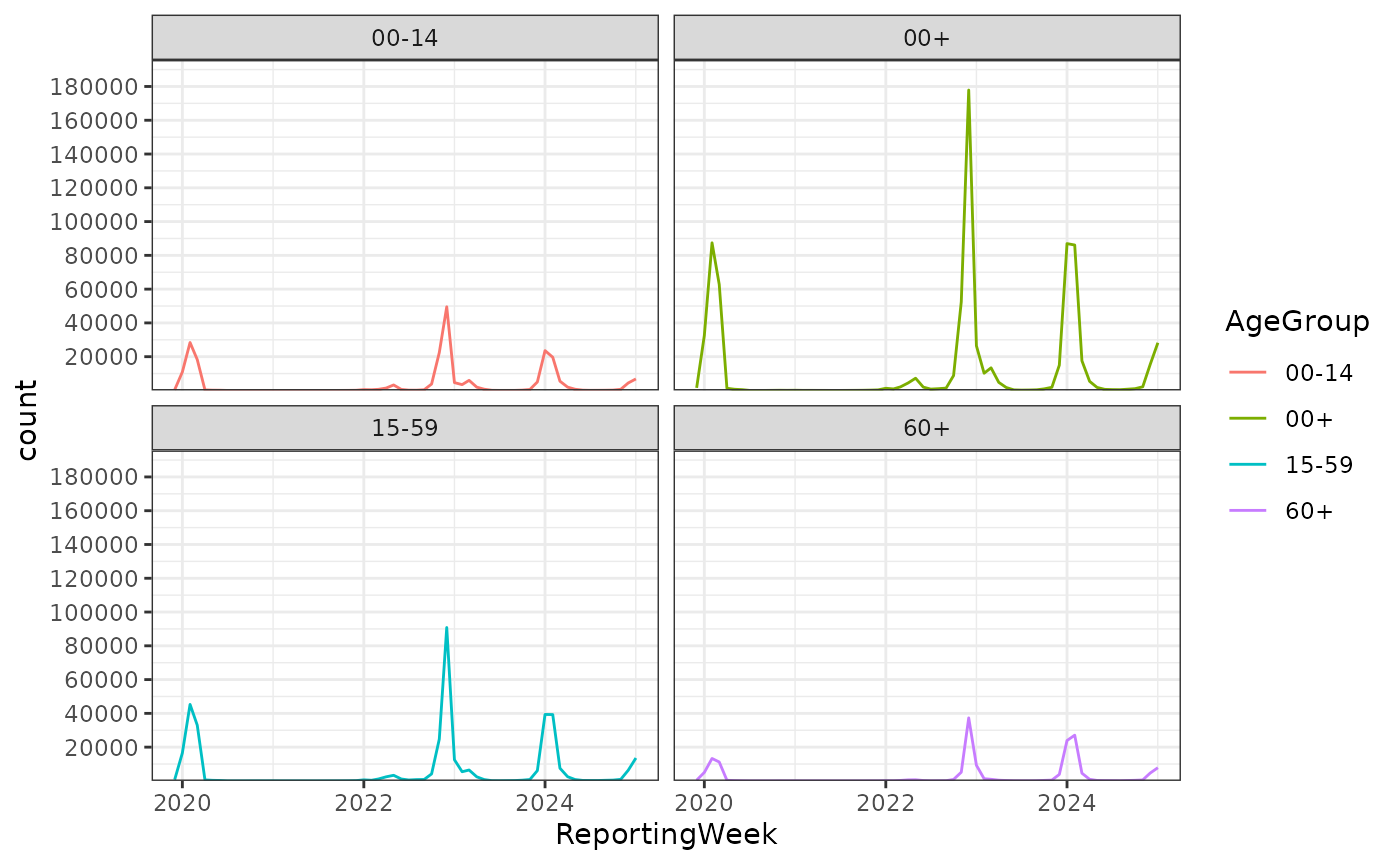
Extra
influenza_germany |>
  # Calc Influenza Seasons
  align_dates_seasonal(dates_from = ReportingWeek) |>
  ggplot(aes(x = ReportingWeek, weight = Cases, color = AgeGroup)) + # , weight = Cases
  geom_line(stat = "bin_date", date_resolution = "month") +
  scale_y_cases_5er() +
  facet_wrap(~AgeGroup) +
  theme_bw()