Continuous x-axis and y-axis scale for (case) counts
Source:R/scale_cases_5er.R
scale_y_cases_5er.RdA continuous ggplot scale for count data with sane defaults for breaks.
It uses base::pretty() to increase the default number of breaks and prefers 5er breaks.
Additionally, the first tick (i.e. zero) is aligned to the lower left corner.
Usage
scale_y_cases_5er(
  name = waiver(),
  n = 8,
  min.n = 5,
  u5.bias = 4,
  expand = NULL,
  limits = c(0, NA),
  labels = waiver(),
  oob = scales::censor,
  na.value = NA_real_,
  transform = "identity",
  position = "left",
  sec.axis = waiver(),
  guide = waiver(),
  ...
)

scale_x_cases_5er(
  name = waiver(),
  n = 8,
  min.n = 5,
  u5.bias = 4,
  expand = NULL,
  limits = c(0, NA),
  labels = waiver(),
  oob = scales::censor,
  na.value = NA_real_,
  transform = "identity",
  position = "bottom",
  sec.axis = waiver(),
  guide = waiver(),
  ...
)
Arguments
- name
The name of the scale. Used as the axis or legend title. If
waiver(), the default, the name of the scale is taken from the first mapping used for that aesthetic. IfNULL, the legend title will be omitted.- n
Target number of breaks passed to
base::pretty(). Defaults to 8.- min.n
Minimum number of breaks passed to
base::pretty(). Defaults to 5.- u5.bias
The "5-bias" parameter passed to
base::pretty(); higher values push the breaks more strongly toward multiples of 5. Defaults to 4.- expand
Uses own expansion logic. Use
expand = waiver()to restore ggplot defaults orggplot2::expansion()to modify- limits
The lower limit defaults to 0 and the upper limits is chosen based on the data. This is the recommended approach for visualizing case numbers and incidences, i.e. the scale starts at 0 and is only positive. To use the default
ggplot2limits uselimits = NULL.- labels
One of the options below. Please note that when
labelsis a vector, it is highly recommended to also set thebreaksargument as a vector to protect against unintended mismatches.NULLfor no labelswaiver()for the default labels computed by the transformation objectA character vector giving labels (must be same length as
breaks)An expression vector (must be the same length as breaks). See ?plotmath for details.
A function that takes the breaks as input and returns labels as output. Also accepts rlang lambda function notation.
- oob
One of:
Function that handles limits outside of the scale limits (out of bounds). Also accepts rlang lambda function notation.
The default (
scales::censor()) replaces out of bounds values withNA.scales::squish()for squishing out of bounds values into range.scales::squish_infinite()for squishing infinite values into range.
- na.value
Missing values will be replaced with this value.
- transform
For continuous scales, the name of a transformation object or the object itself. Built-in transformations include "asn", "atanh", "boxcox", "date", "exp", "hms", "identity", "log", "log10", "log1p", "log2", "logit", "modulus", "probability", "probit", "pseudo_log", "reciprocal", "reverse", "sqrt" and "time".
A transformation object bundles together a transform, its inverse, and methods for generating breaks and labels. Transformation objects are defined in the scales package, and are called
transform_<name>. If transformations require arguments, you can call them from the scales package, e.g.scales::transform_boxcox(p = 2). You can create your own transformation withscales::new_transform().- position
For position scales, The position of the axis.
leftorrightfor y axes,toporbottomfor x axes.- sec.axis
sec_axis()is used to specify a secondary axis.- guide
A function used to create a guide or its name. See
guides()for more information.- ...
Additional arguments passed on to
base::pretty().
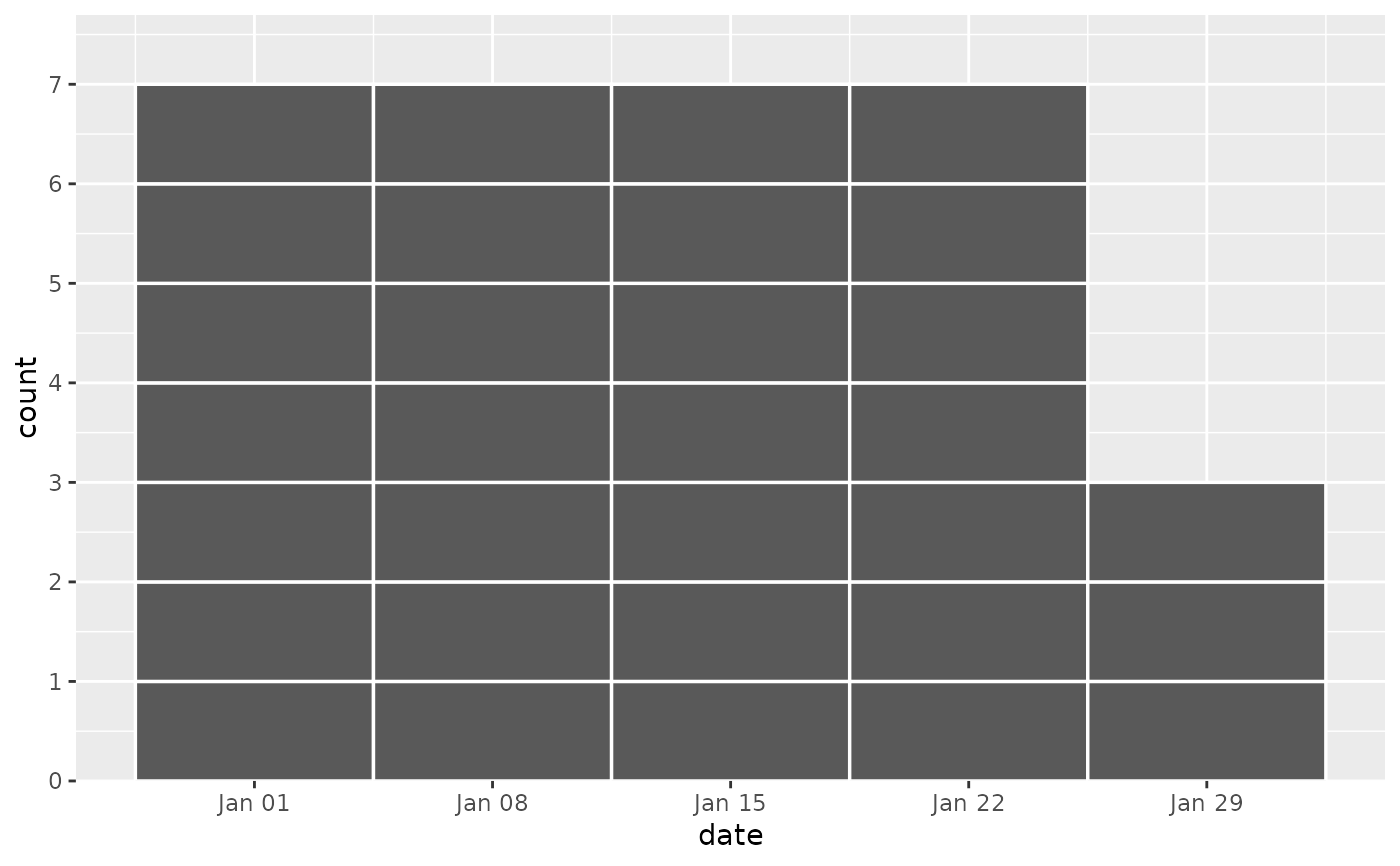
Examples
library(ggplot2)

data <- data.frame(date = as.Date("2024-01-01") + 0:30)
ggplot(data, aes(x = date)) +
  geom_epicurve(date_resolution = "week") +
  scale_y_cases_5er() +
  theme_mod_remove_minor_grid_y()