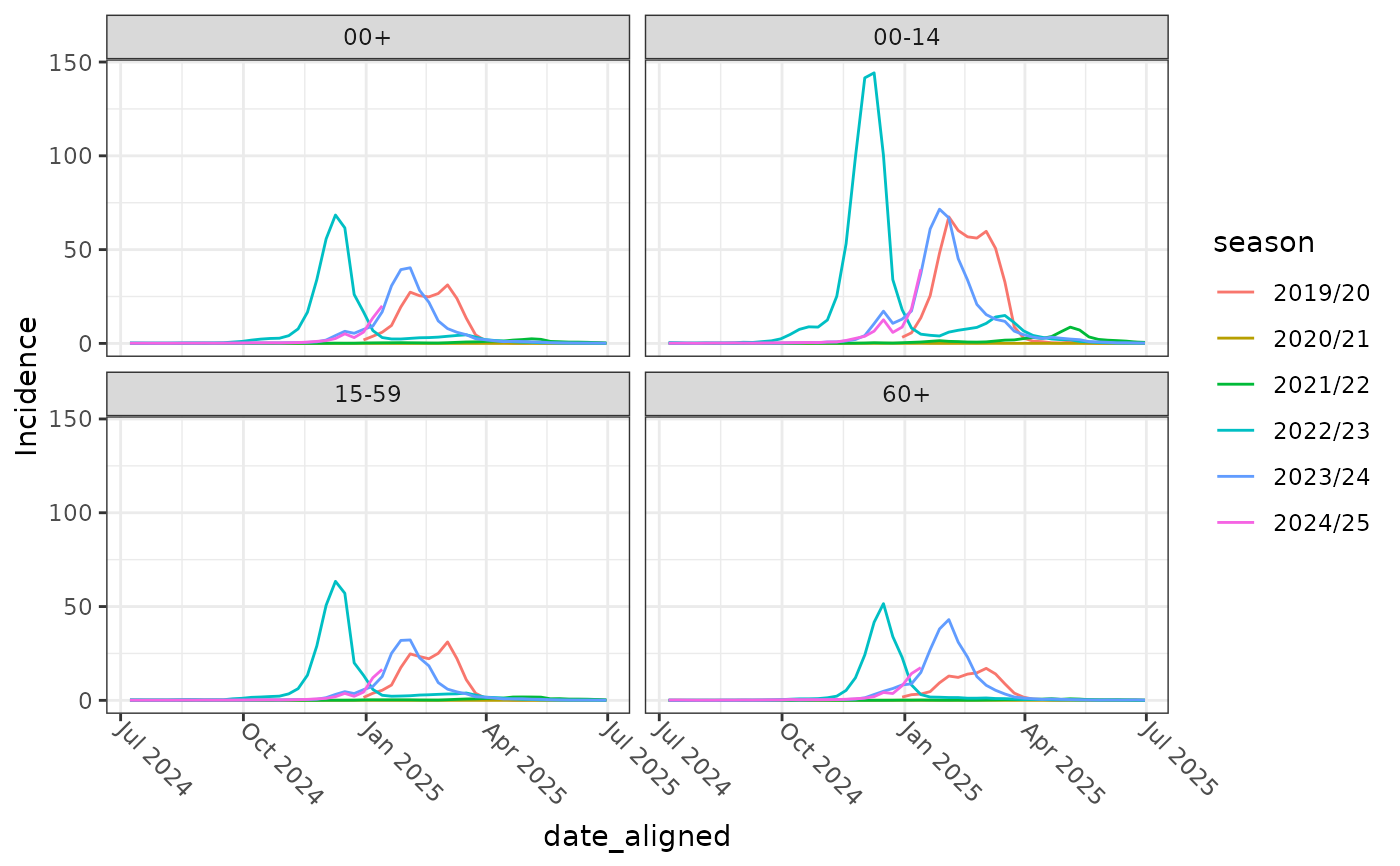
A subset of the weekly German influenza surveillance data from January 2020 to January 2025.
Format
A data frame with 1,037 rows and 4 columns:
- ReportingWeek
Reporting Week in "2024-W03" format
- AgeGroup
Age groups:
00+for all and00-14,15-59and60+for age stratified cases.- Cases
Weekly case count
- Incidence
Calculated weekly incidence
Source
License CC-BY 4.0: Robert Koch-Institut (2025): Laborbestätigte Influenzafälle in Deutschland. Dataset. Zenodo. DOI:10.5281/zenodo.14619502. https://github.com/robert-koch-institut/Influenzafaelle_in_Deutschland
Examples
library(ggplot2)

influenza_germany |>
  align_dates_seasonal(
    dates_from = ReportingWeek, date_resolution = "isoweek", start = 28
  ) -> df_flu_aligned

ggplot(df_flu_aligned, aes(x = date_aligned, y = Incidence, color = season)) +
  geom_line() +
  facet_wrap(~AgeGroup) +
  theme_bw() +
  theme_mod_rotate_x_axis_labels_45()